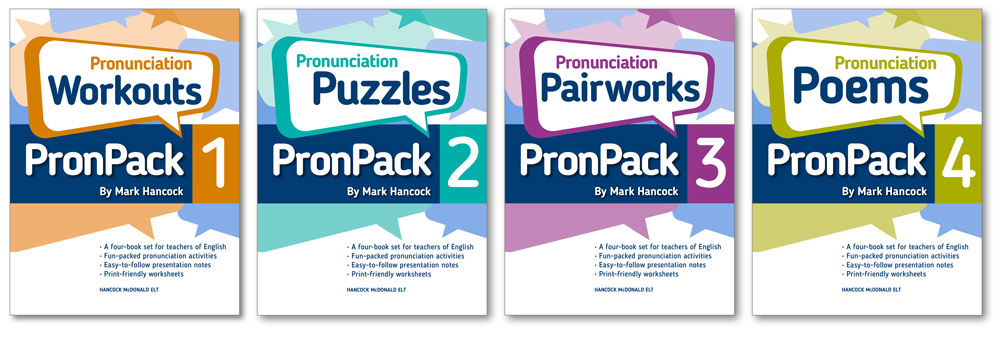
“…Hancock has reconceptualised our pron chart brilliantly…”. Here’s a great review of PronPack by Brian Brennan in MET!
Continue reading “PronPack Review in Modern English Teacher”
“…Hancock has reconceptualised our pron chart brilliantly…”. Here’s a great review of PronPack by Brian Brennan in MET!
Continue reading “PronPack Review in Modern English Teacher”
IATEFL PronSIG is holding an event in the beautiful city of Chester on February 17th, 2018. Only 2 hours by train from London, Chester is a place steeped in layers of history, and the event will take place at the city’s University. ‘Pronunciation: the Missing Link’. As the title implies, many of the presentations at this event will be about the link between pronunciation and other areas of language teaching – links which are often neglected.
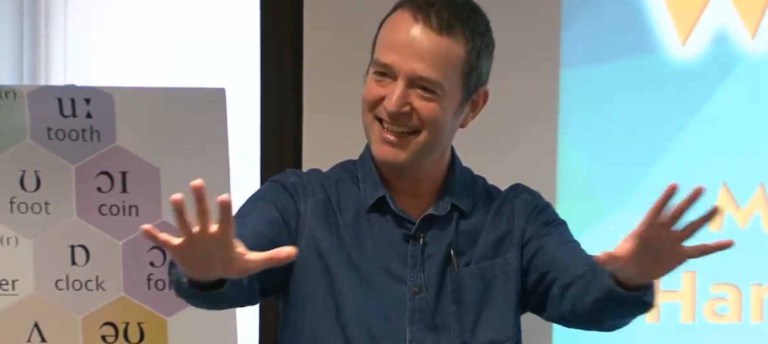
The PronPack Sound Chart is featured on the cover of the latest issue of Modern English Teacher. Inside the magazine, I have written an article explaining the vowel chart entitled “Putting Vowels on the Map”.
Meanwhile, in the “Book I’ve Used” section, there is a review of PronPack written by Brian Brennan of Ih Barcelona. Here are a few quotes…
“Hancock’s approach is strikingly innovative”
“Hancock has reconceptualised our pron chart brilliantly”
“PronPack sets out to fill a gap and it does so admirably”
Great to see a lovely review of PronPack in English Teaching Professional here, (Issue 113, November 2017, pp. 35, 36) by Steve Hirschhorn in Hungary. Below are a few quotes: Continue reading “PronPack Reviewed in English Teaching Professional”
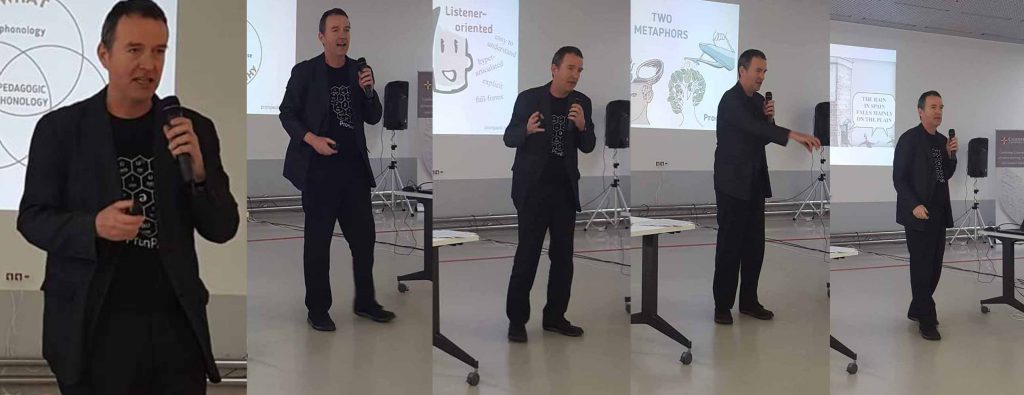
Presenting in Moscow at the MISis University conference on EAP, ESP and EMI. I suggested that pron teachers need to keep in mind the three questions what, how and why. (Thanks to Beata Walesiak for the photos)
Moscow, 24th Nov 2017: The globalisation of English has multiple implications for the teaching of the language, especially to those learners whose main use of English will be for international communication, often in the absence of native speakers. Nowhere are these implications more far-reaching than in the teaching of pronunciation. This symposium looks at the goals of pronunciation teaching in this new era, and at learner attitudes to new goals, and at classroom practices suited to achieving the new goals.
Mark Hancock at TESOL Italy, Rome, Nov 17th 14:00
“Pronunciation: be a teacher not a preacher”
Pronunciation teaching can be fun, but in a world where English is a lingua franca, we need to take a flexible approach. We can’t simply preach a single ideal target model, instead, we must teach learners to be adaptable, both receptively and productively. In this session, I will demonstrate this.
Presenting at the joint IATEFL PronSIG/GISIG event in London. Pronunciation teaching has neglected the ‘why’ wheel of the tricycle, leaving us with a default RP or GA model. Thanks to Laura Patsko for the photo.
Perhaps pronunciation teachers need a taxonomy of lower to higher order pronunciation skills. ‘Copy’ is at the lower end of the spectrum and ‘Accommodate’ at the higher end. If you’re around Madrid next week (Oct 20th), I’m doing a talk on it. http://hancockmcdonald.com/talks/pronunciation-be-teacher-not-preacher-0
Most teachers of English will have come across a sound chart at some point, but few realise how arbitrary they are. I do not mean ‘arbitrary’ in the negative sense of ‘with no good reason’, but rather in the sense that there are choices that the designer has had to make. At every stage in the creation of a chart, the author will have made decisions which could equally well have been otherwise. Phonetic facts interplay with pedagogic priorities and graphic limitations, and these forces do not always pull in the same direction, so that compromises are required. Chart design is as much an art as a science.
A chart is not objective reality, but one person’s model of reality. In this article, I will present a sound chart of my own creation and explain the rationale for the decisions I made when designing it. The full charts referred to below can be viewed here. Continue reading “The Art of the Chart”